FarmBeats
Microsoft sponsored project
Enhance farmers' work efficiency by integrating IoT solutions within a SaaS framework to monitor and manage rust disease.
Timeline
Team
Role
Overview
Context
FarmBeats is a Microsoft research project designed to enable data-driven farming by addressing the lack of precise, real-time data that leads to inefficiencies in agriculture. As part of this initiative, we students from the University of Washington are collaborating with client, Nelson Wheat, to design a product that monitors crop health and tackles this challenge.
Solution
We integrate IoT (Internet of Things) into a SaaS framework to collect, transmit, and monitor real-time farm data. We also leveraged generative AI to analyze outcomes, helping farmers reduce losses.
I work cross platforms

Problem
Break the problem to feasible opportunities

In the kick-off meeting, the client raised concerns about stripe rust (yellow rust) disease in wheat crops.
Our research revealed that managing stripe rust is challenging due to its timing. The disease thrives in temperatures between 45 and 54 degrees Fahrenheit and requires six to eight hours of leaf moisture. These conditions favor the disease and can lead to severe crop damage if not addressed quickly. Therefore, we propose the goal:
How to timely monitor temperature, humidity, and leaf images in real-time, and report to farmers to prevent yellow leaf disease.
[1] https://www.cropscience.bayer.us/articles/cp/wheat-rust-diseases
Main features
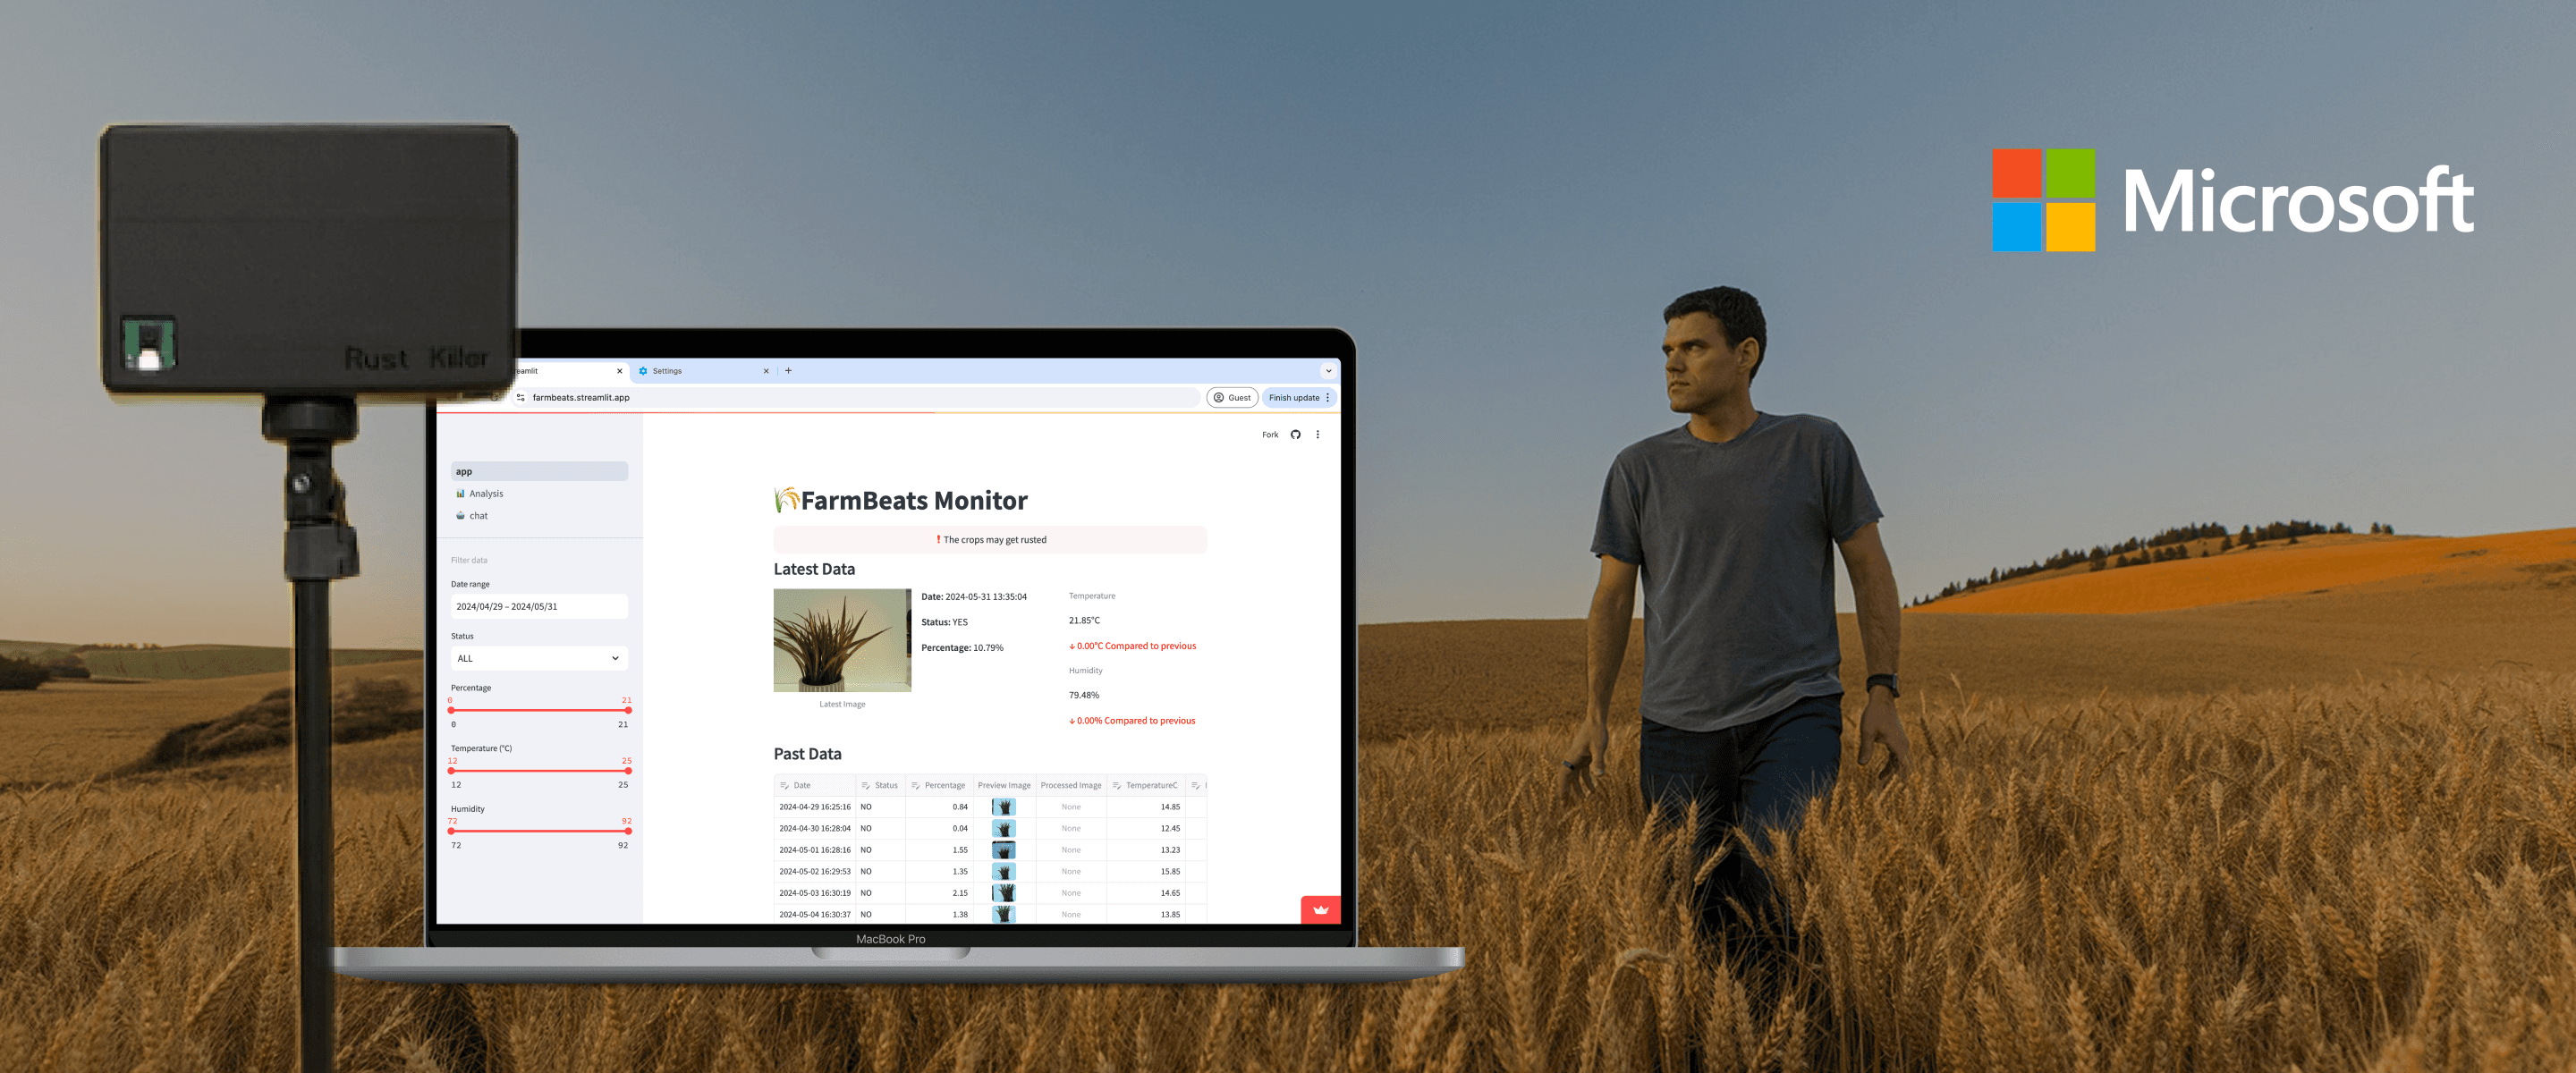
1/Data monitor and alerts for timely rust detection
The top section shows the latest farm climate data and crop health status, along with change insights and disease risk. Alerts pop up when rust is detected. Based on client feedbacks, manually correct original images and submit data is allowed. Filters allow for time range selection and customized comparisons.
2/Data visualization for analysis and trend revelation
Key trends in temperature, humidity, and pressure are presented visually, along with correlation charts that illustrate the relationship between these factors and rust incidence. It empowers farmers to understand and proactively prevent issues.
3/ChatBot for personalized assistance
It's integrated with a cloud database and Gemini API, allowing farmers to ask questions in natural language about recent data peaks or the risk of disease occurrence.
How did we approach that?
Research
Competitor analysis - define the technology we use
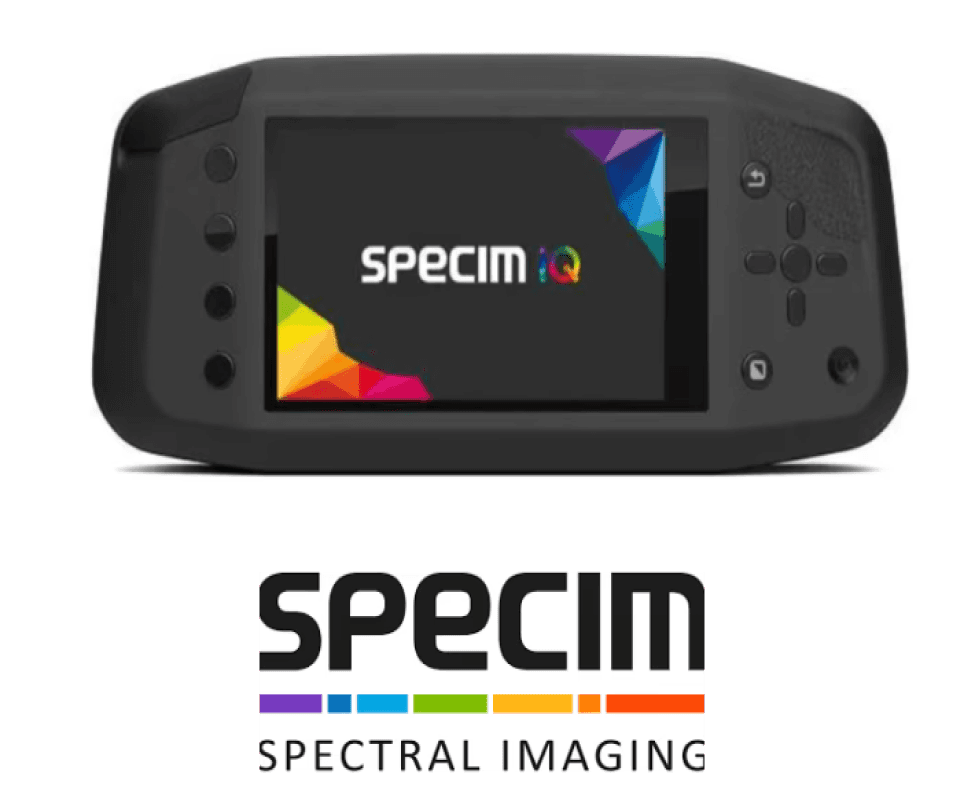
We considered both Full Hyperspectral Imaging Systems and IoT solutions. However, based on cost and technical feasibility, IoT is the more affordable option, which can continuously monitor farm conditions to detect issues effectively. Raspberry Pi 4 was chosen for the low cost and easy to use.
Detailed data analysis
High cost
Limited scalability
Requires specialized training
Low cost
Highly scalable
Real-time monitoring
User-friendly interfaces
Market research - target the segment market
The agricultural IoT market is set to grow from USD 11.4 billion in 2021 to USD 18.1 billion by 2026, with a CAGR of 9.8%. This highlights a clear opportunity. While the existing solutions focus on large farms and can be expensive, we’ve identified a blue ocean: no products currently cater to small-scale organic farms. This gap demonstrates our ability to pinpoint and target underserved market needs effectively.

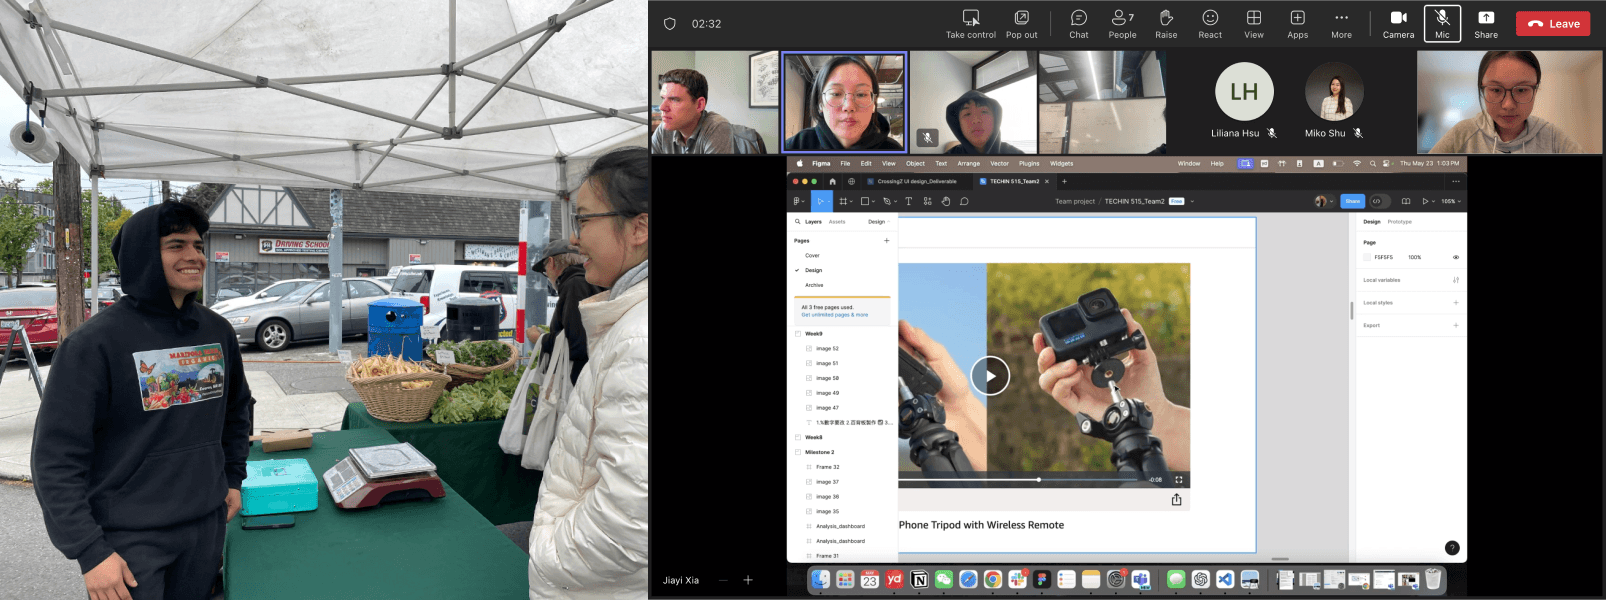
Pitch to user - get feedbacks
To gather feedback and validate our assumptions, we conducted interviews with four farmers in Washington state to explore market opportunities and identify user pain points. Additionally, our weekly meetings with our client, Andrew Nelson, provide us with valuable user feedback and professional advice at each step of the process.
Research findings

Ideation
Hardware/Software system - choose the frameworks in the early stage
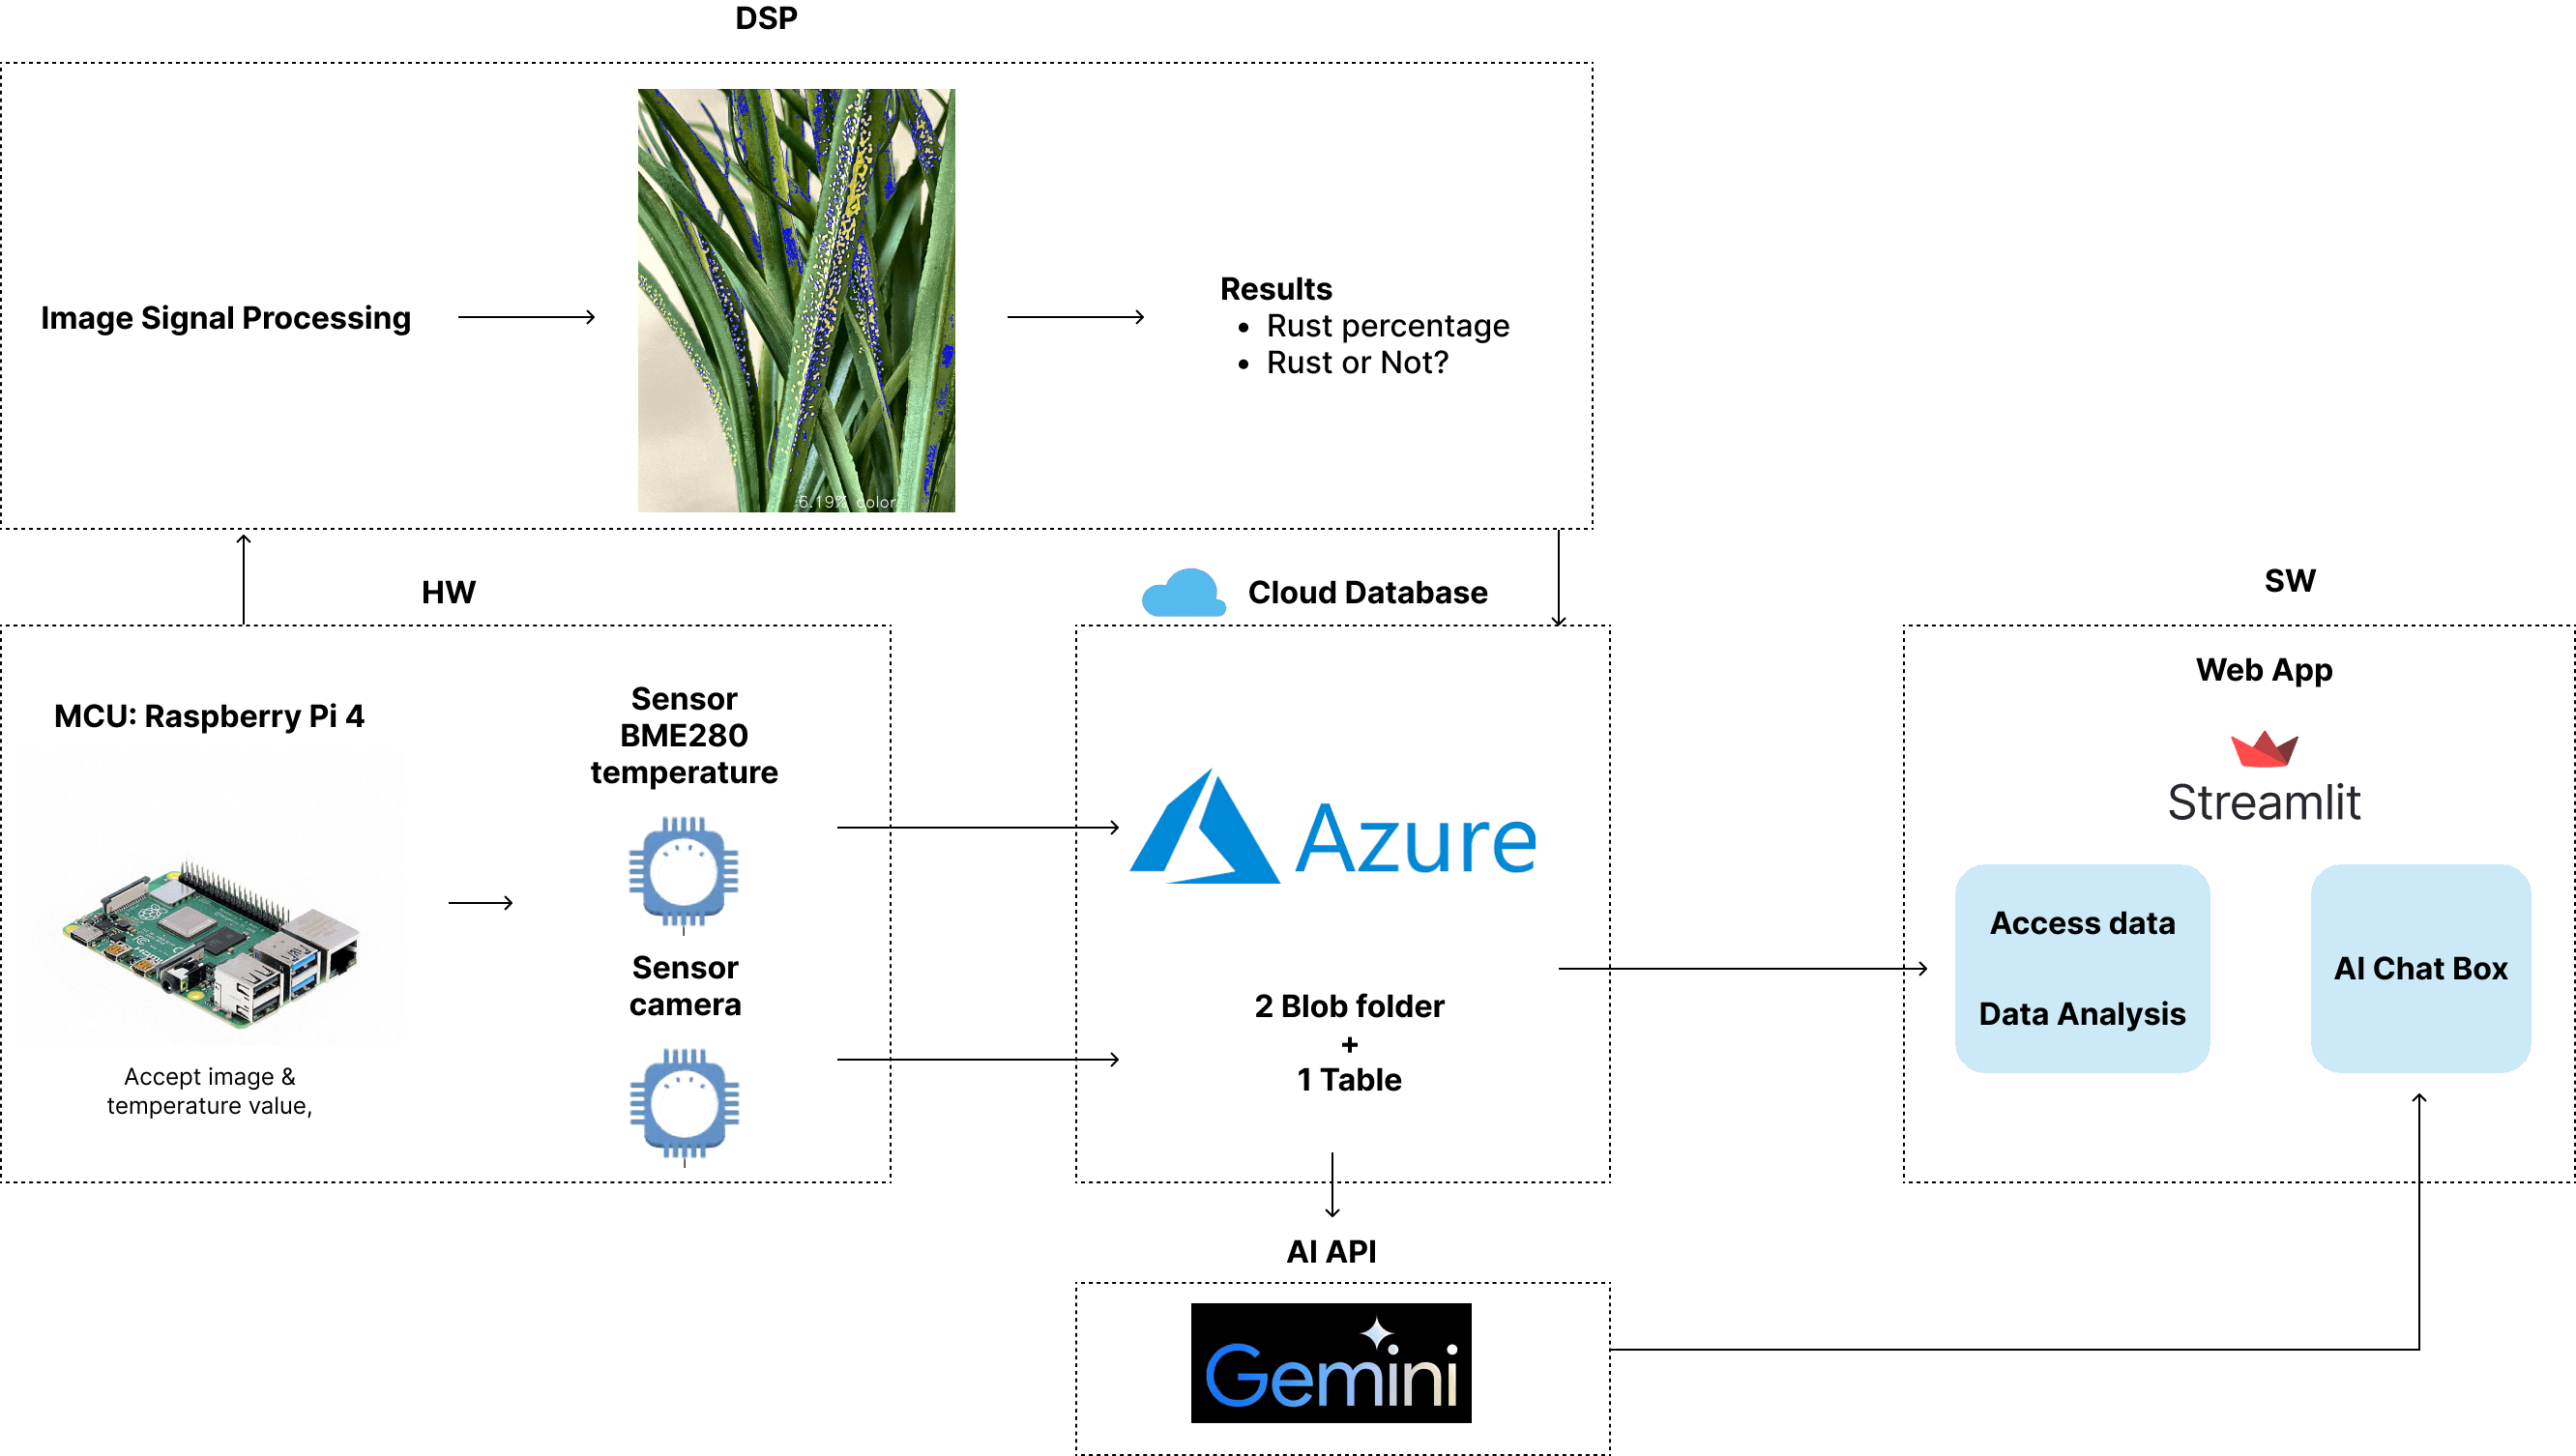
To build the IoT system, we created a hardware/software framework to outline the necessary technologies, documentation, and data transfer methods. We also choose the needed sensors, technology, and database. This helped us delegate tasks and stay organized when things got complicated.
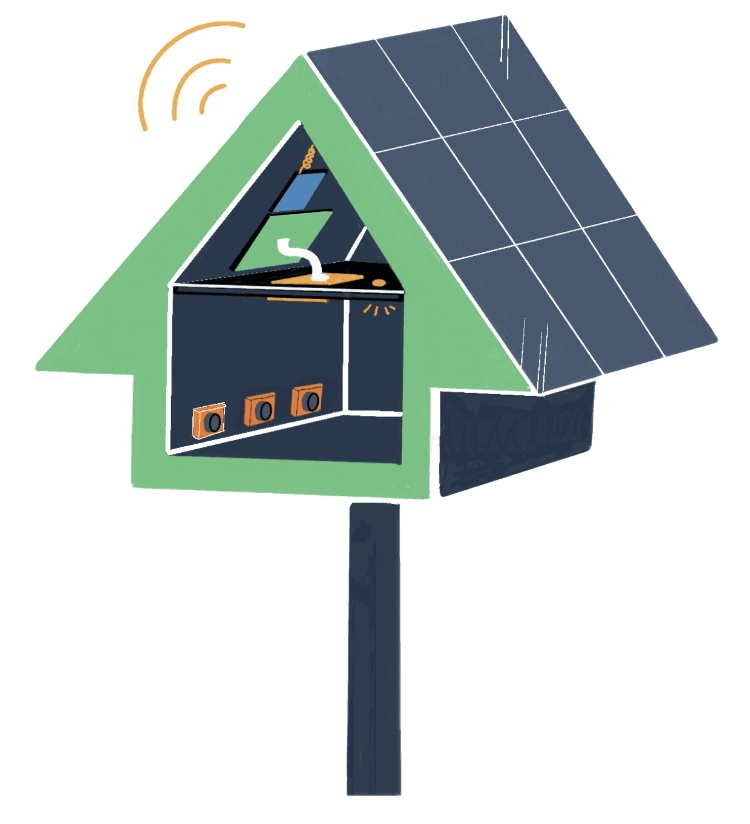
Hardware/Software system
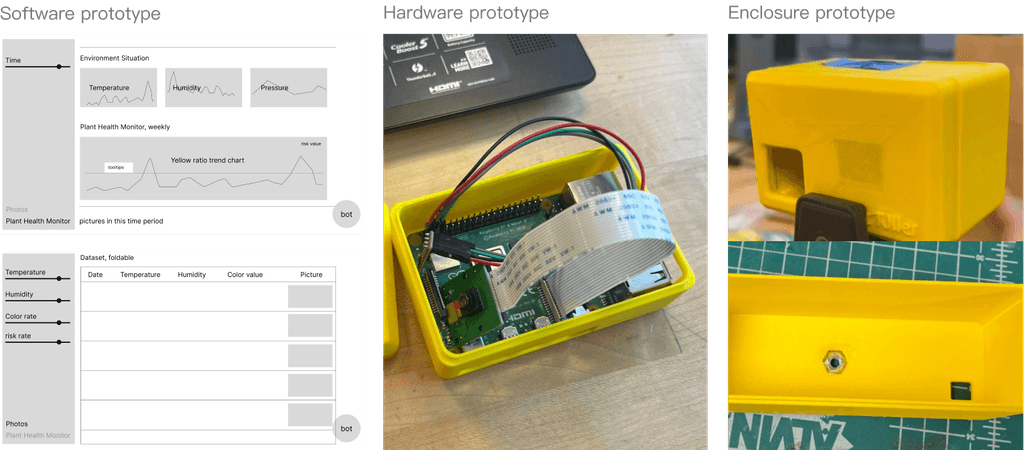
Rapid prototypes and quick iteration
Due to time constraints, we created rapid prototypes and conducted multiple quick iterations based on hardware size and compatibility. Interestingly, Andrew's field experience gave helpful advice, like ensuring the sensor opening on the casing doesn't face upwards to avoid rainwater buildup.
Challenges
Breaking barriers - building data, dividing tasks, and training in steps
Challenge 1 - dataset: We struggled to train our hardware to identify rust due to a lack of real infected wheat images. Online resources were limited. To solve this, I suggested buying plastic plants and simulating rust with a yellow marker, quickly resolving our dataset issue.
Challenge 2 - complex system and unfamiliar technology. We also faced the challenge of developing a large system. To manage this, we broke the project into three components: training the recognition code, creating the cloud database, and developing the front-end framework. By keeping close communication, we successfully integrated all parts before our milestone.

solutions
Hardware
We use Raspberry Pi 4 controlled the system, took images, calculated the rust percentage, and made judgments. It also recorded temperature and humidity. All data were sent as two parts and stored in Azure, with timestamps connected as one record and visualized in user interface for cross reference.

Software
We used Streamlit, a low-code developing platform, to build the web app. Using open-source data visualization charts, we quickly created the UI and conducted multiple rounds of usability testing. Feedback from clients and tech specialists helped us improve the design and gave us valuable insights into real software development.
THANKS to my team!

Reflection
01. User-driven and client-driven design
User-driven design isn't just about solving technical problems—it's about constantly adjusting our approach based on the client’s perspective. By discussing specifics, such as their concerns about system stability or the ideal distance for the camera to capture images in real working environment, we were able to gain valuable insights that informed the design process.
02. Designing with developers in mind
I’ve learned to better understand the developer's perspective, especially when designing interactions like updating databases or preserving data. Now, I think more about how my designs will be implemented, especially with data visualizations or UI elements. This helps me balance the look of the UI with how it works in the backend, ensuring my designs are both user-friendly and easier for developers to build.