AI-driven dashboard improvement
NetEase.Inc., Loadlab
Enhancing the AI-assisted financial analytics platform to increase user trust and improve understanding
Timeline
July 2022 - Oct 2022
Team
1 PM, 2 Engineer
2 UX Designers
2 Co-founder
Role
Product design
UXUI design
User research
Overview
Context
With an influx of retail investors in the market, there is an increasing demand for advanced analytics (Source: Nasdaq). Indicate Lab, a fintech startup, specializes in quantitative analysis. Armadillo, their AI-assisted product, bridges the gap between analysts and individual investors by offering valuable investment insights.
Problem space
However, over 50% of current users are NOT satisfied and lack trust with the AI-assisted dashboard, and the project model presented by analysts has a low subscription.
My objective
As a product designer, I took the initiative to revamp investor dashboards, driving improvements in user experience, boosting subscriptions, and attracting funding. I led efforts to design solutions that catered to both entry-level and advanced users, creating intuitive dashboards and complex visualizations. My focus was on building trust in AI-assisted solutions by delivering clear, impactful insights that empowered investors to make informed decisions.

Highlights
Impact
Subscribers increased by
+ 300%
increased to 1.2 k
Bring fundings
+ $$$
Succeed in the pre-seed funding stage
Understand User
Challenge
How can I learn WHO are target users, WHAT they want, and WHY they are not satisfied with the dashboard?
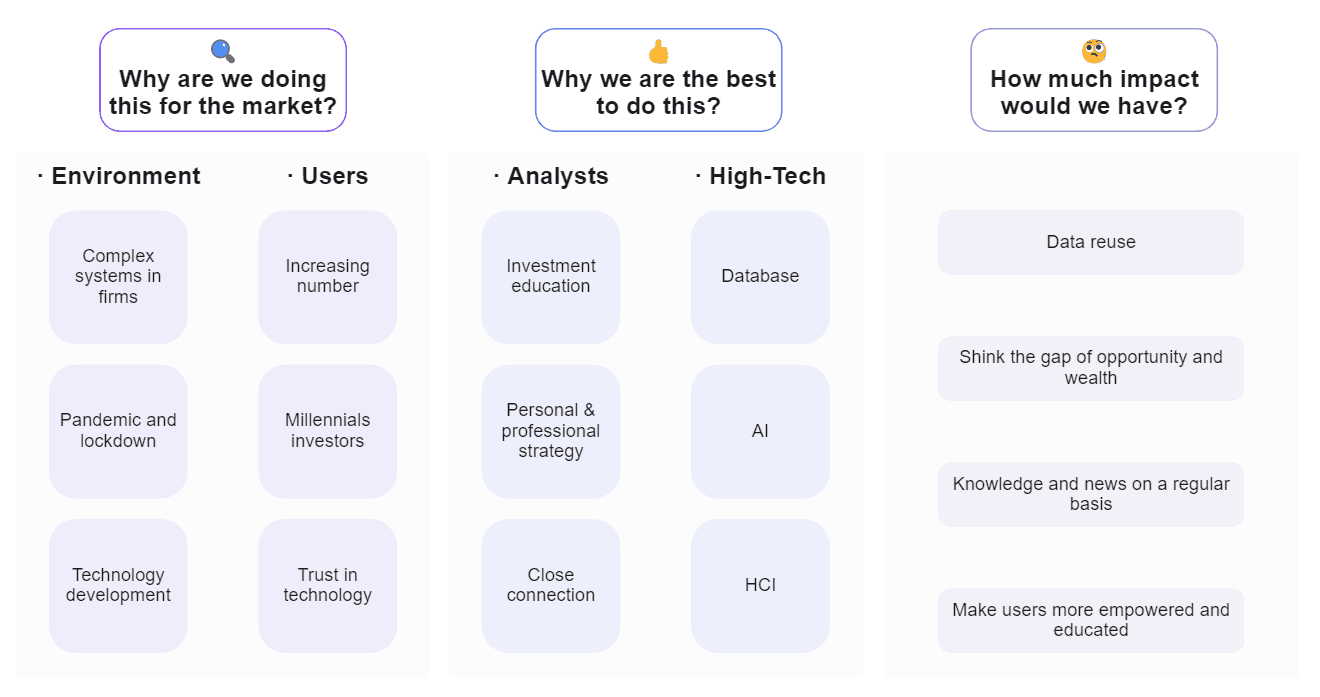
Use Secondary Research and Competitor Analysis to understand market’s need and our opportunities
I focused on researching the retail investor market and learning from other AI-assisted investment platforms. I discovered that we have many potential users. Our main goals are to build trust in the AI advisor and make it user-friendly.
Research Focal Point
Competitor Analysis

Via Quantitive Survey and Qualitative Interview to define target users, their investment habit, and current pains
We surveyed 63 investors to learn about their expectations and usage patterns of the AI investment analysis platform. We also carried out 6 usability tests, each lasting 60 minutes, with current users. Engineers are invited to help in interview for better consensus at this stage.

After investigation, I found we actually have 2 group of users—Entry Level Users and Advanced Users

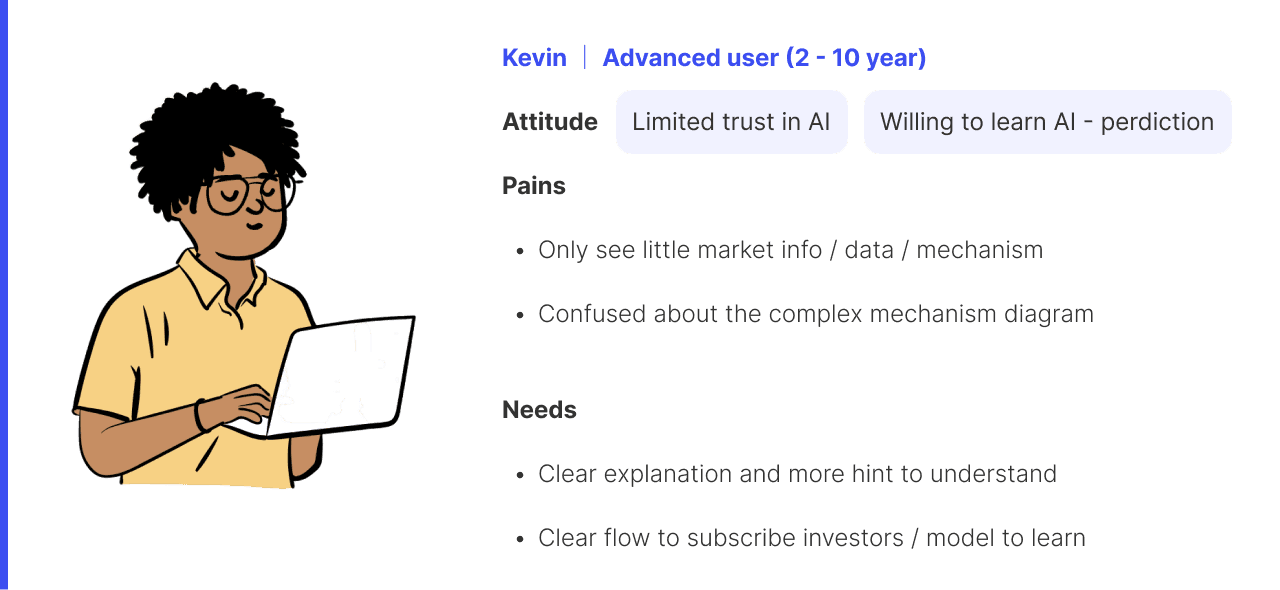
Insights

How might we provide users with more trustable data, transparent advice, and understandable analytical explanation, to help them make investment decisions easily?
Ideation
Narrow down on MVP scope
Discussing with stakeholders, we decided to narrow down the scope and mainly focus on the Projection page (the dashboard). So I dived into this part to arrange the new user flow, adding with new feature and improve interactions.

Wire framing
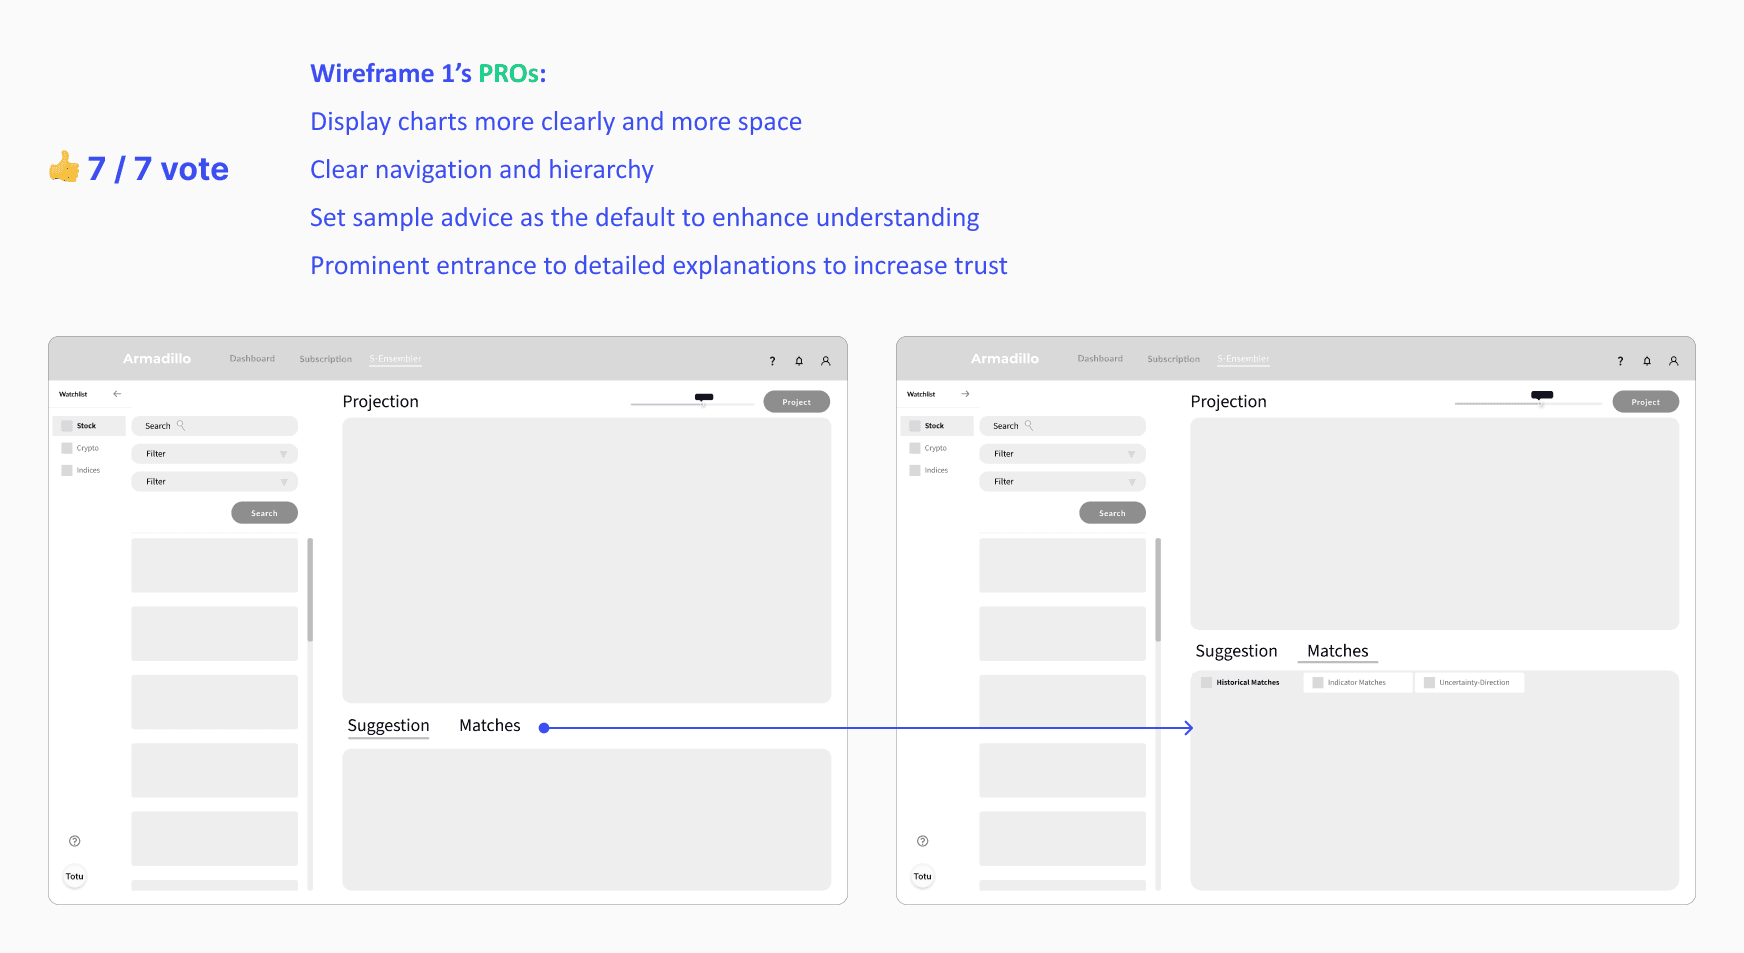
Wire framing and trade-offs
I created two dashboard wireframes and discussed them with stakeholders. Eventually, we decided to combine the direct suggestion and the advanced reasons (matches chart) into one frame, with the direct suggestion set as the default option.
Usability Test in Mid-Fi
In middle-fidelity stage, we reached out 5 people for usability tests. Each interview lasted about 60 minutes. Then we carried on the iteration.
Task 1:
Can user understanding the information they get (eg.prediction accuracy)?
Insights and iteration: We found users need guidance to connect prediction outcomes to the next phase of their investigation. After exploration and discussion, I used color-coding to directly hint for high / low accuracy of the prediction.

Task 2:
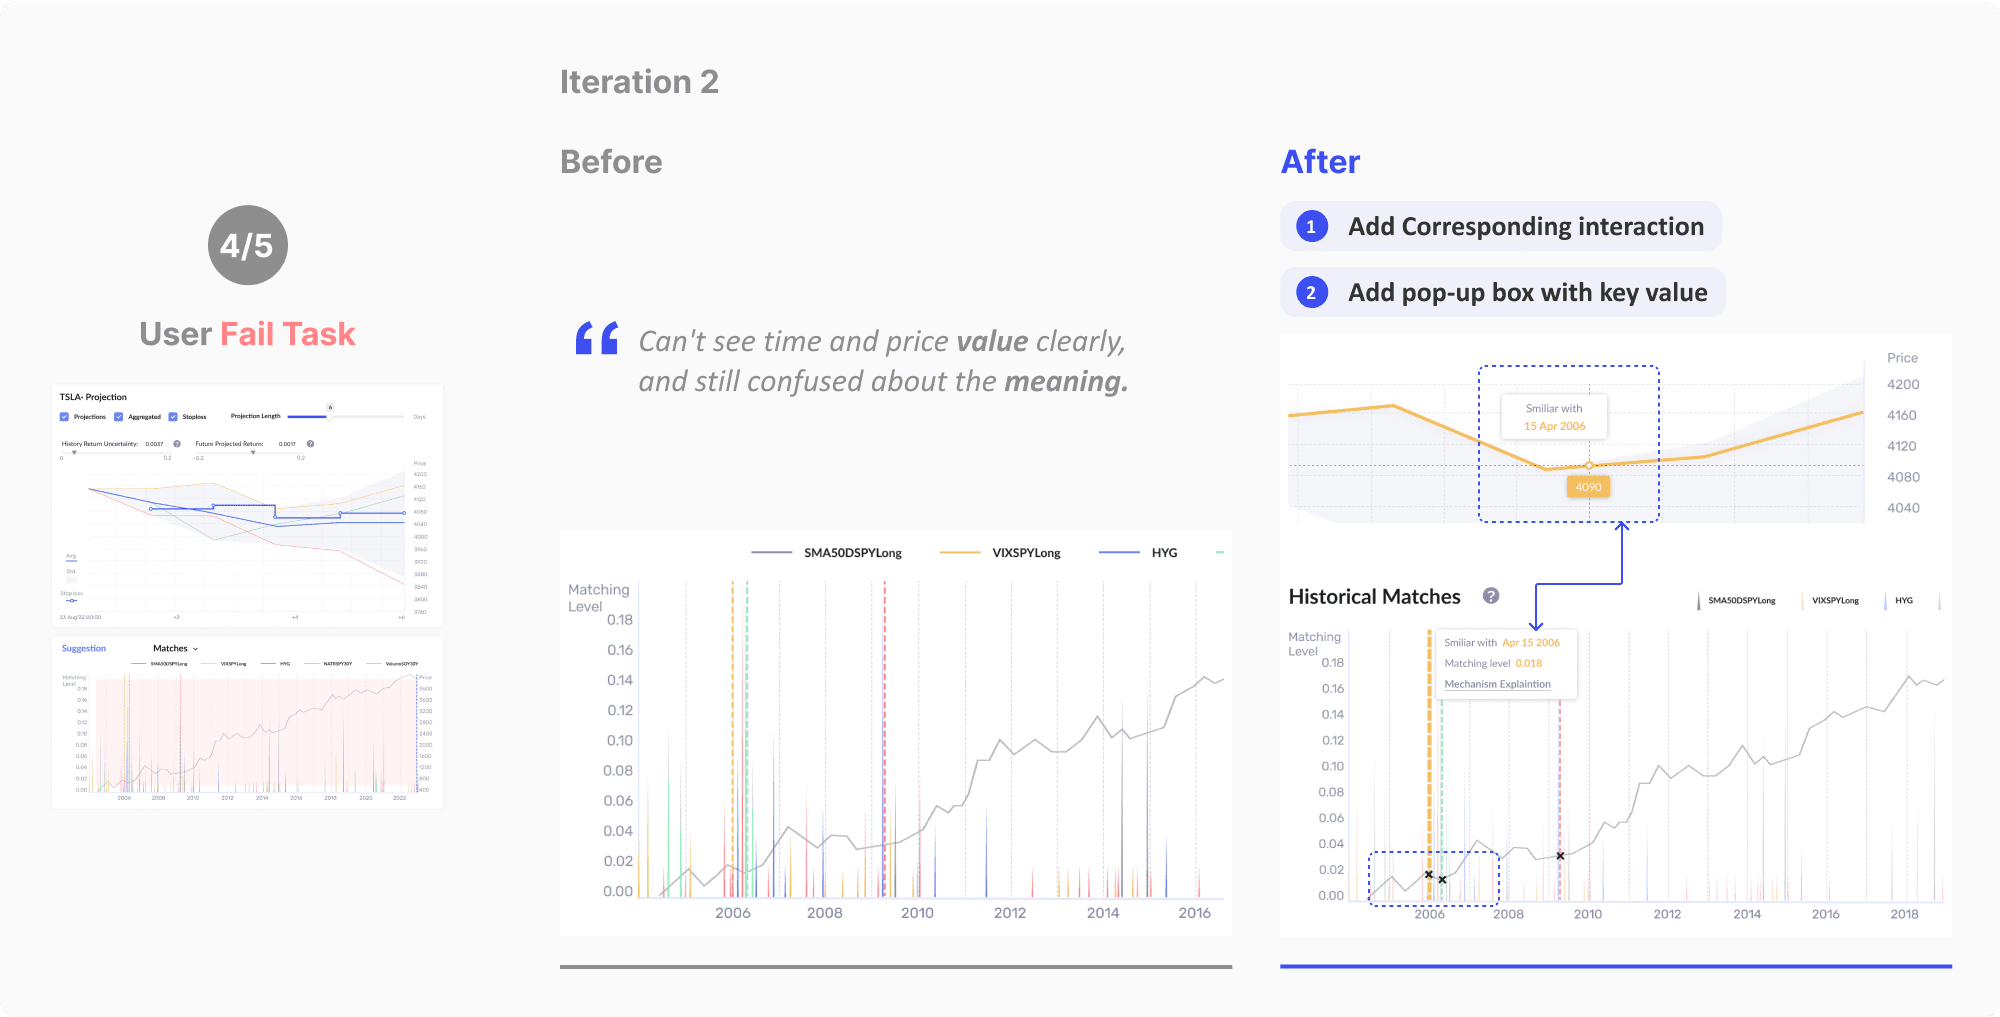
Can user understand and trust the AI-assisted result in complex charts?
Insights and iteration: Users need to easily understand and recognize the data presented to them. After trade-offs considering technical constrains, I decided to add a pop up box and bolded lines for cross-references when elements are hovered and provide way for explanations.
Design system
Before the final version, I generate a component library for the product. Its initial implementation significantly enhanced development efficiency, improve interface consistency, and facilitate collaboration in the subsequent month.
Developing rate improve by
25%

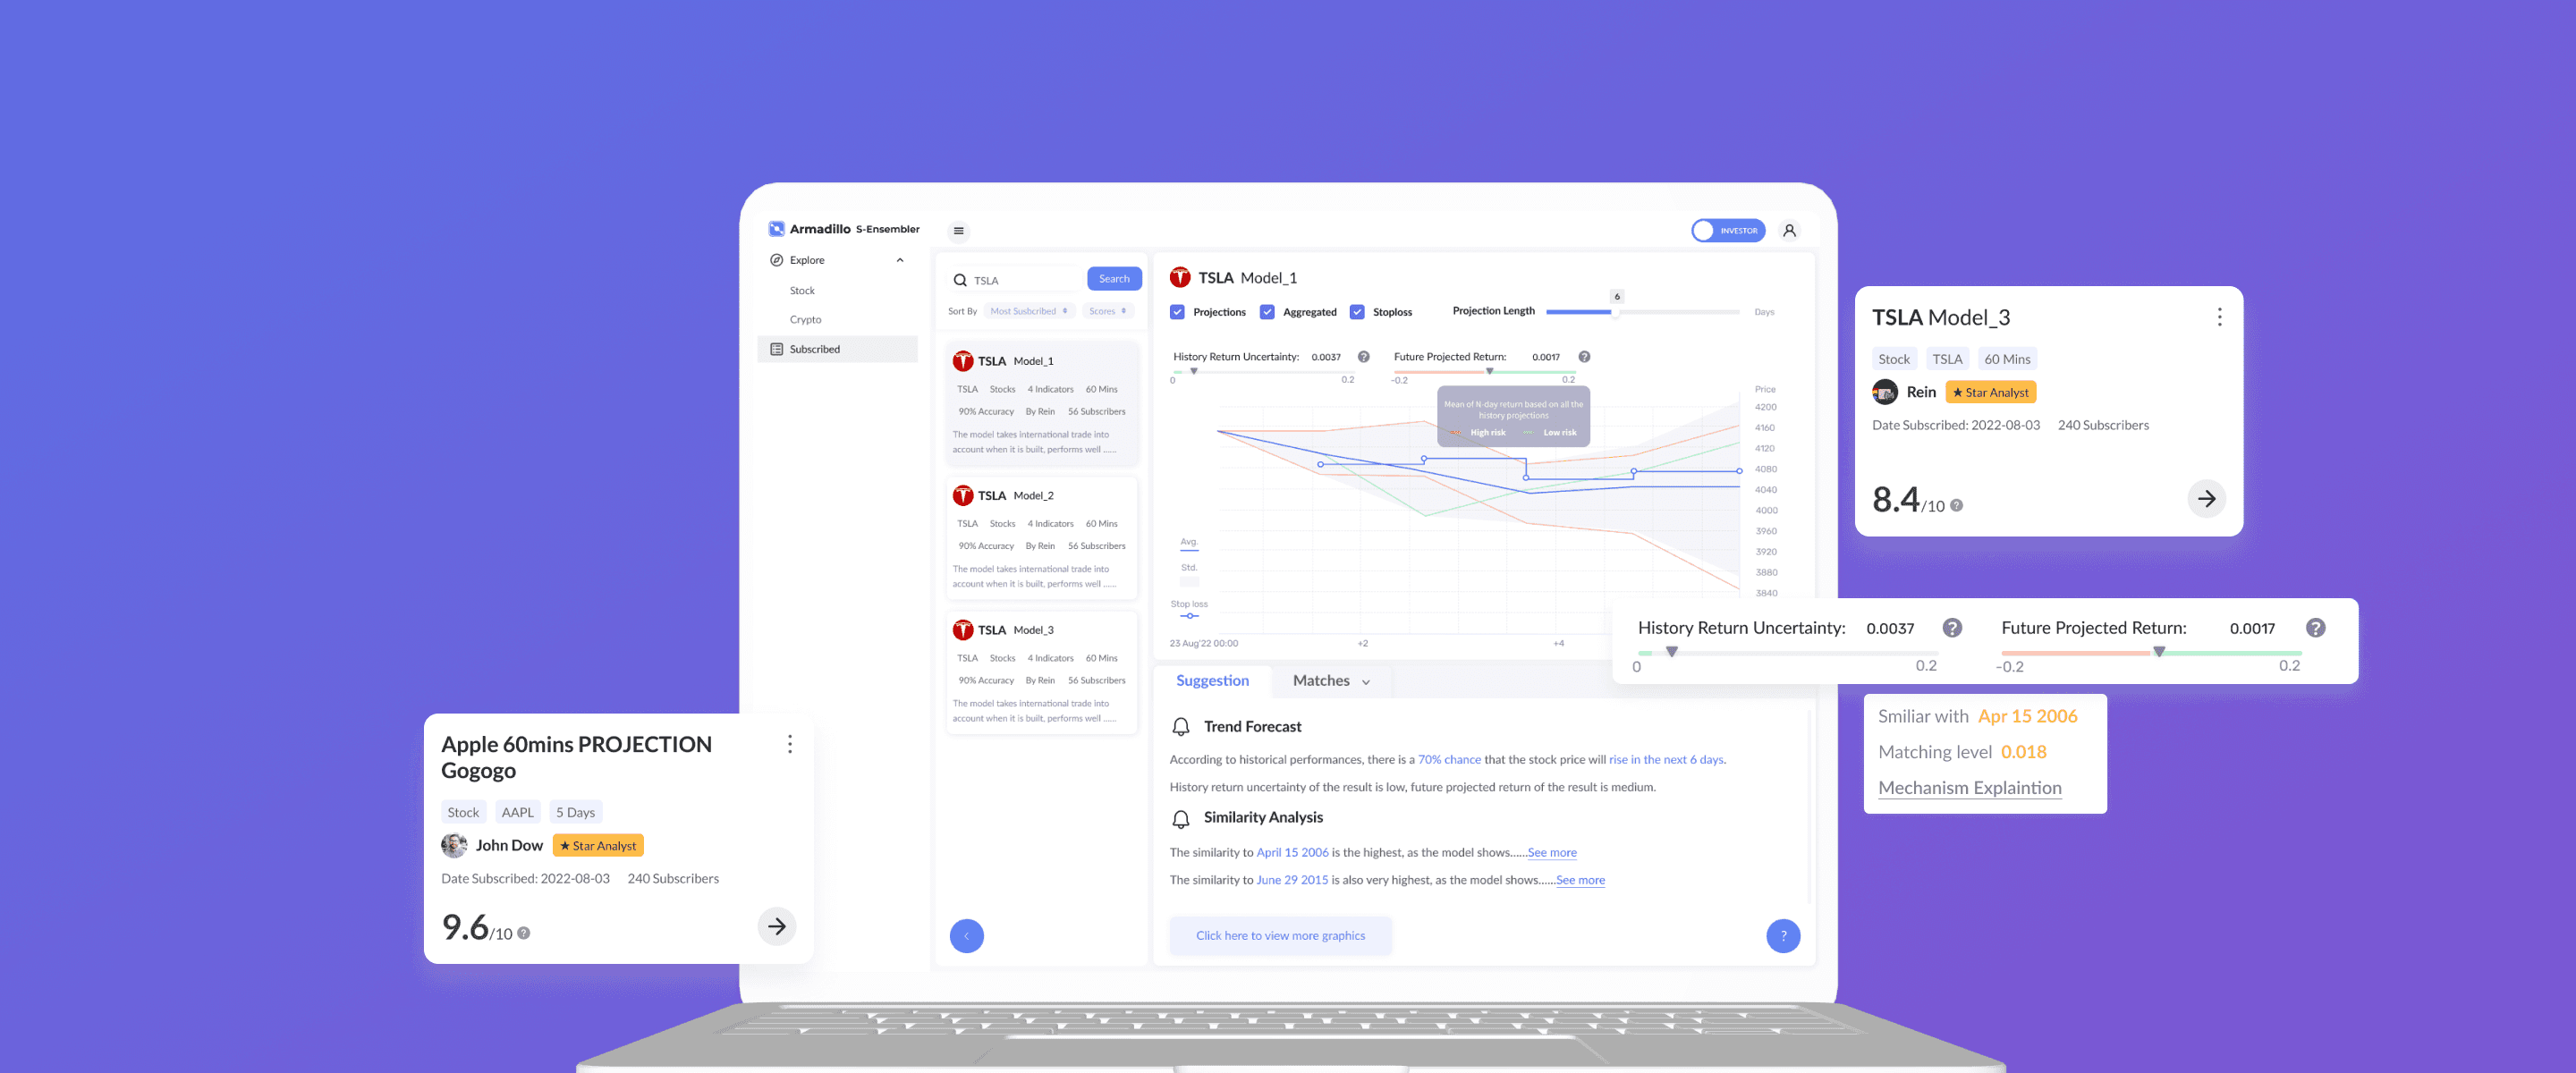
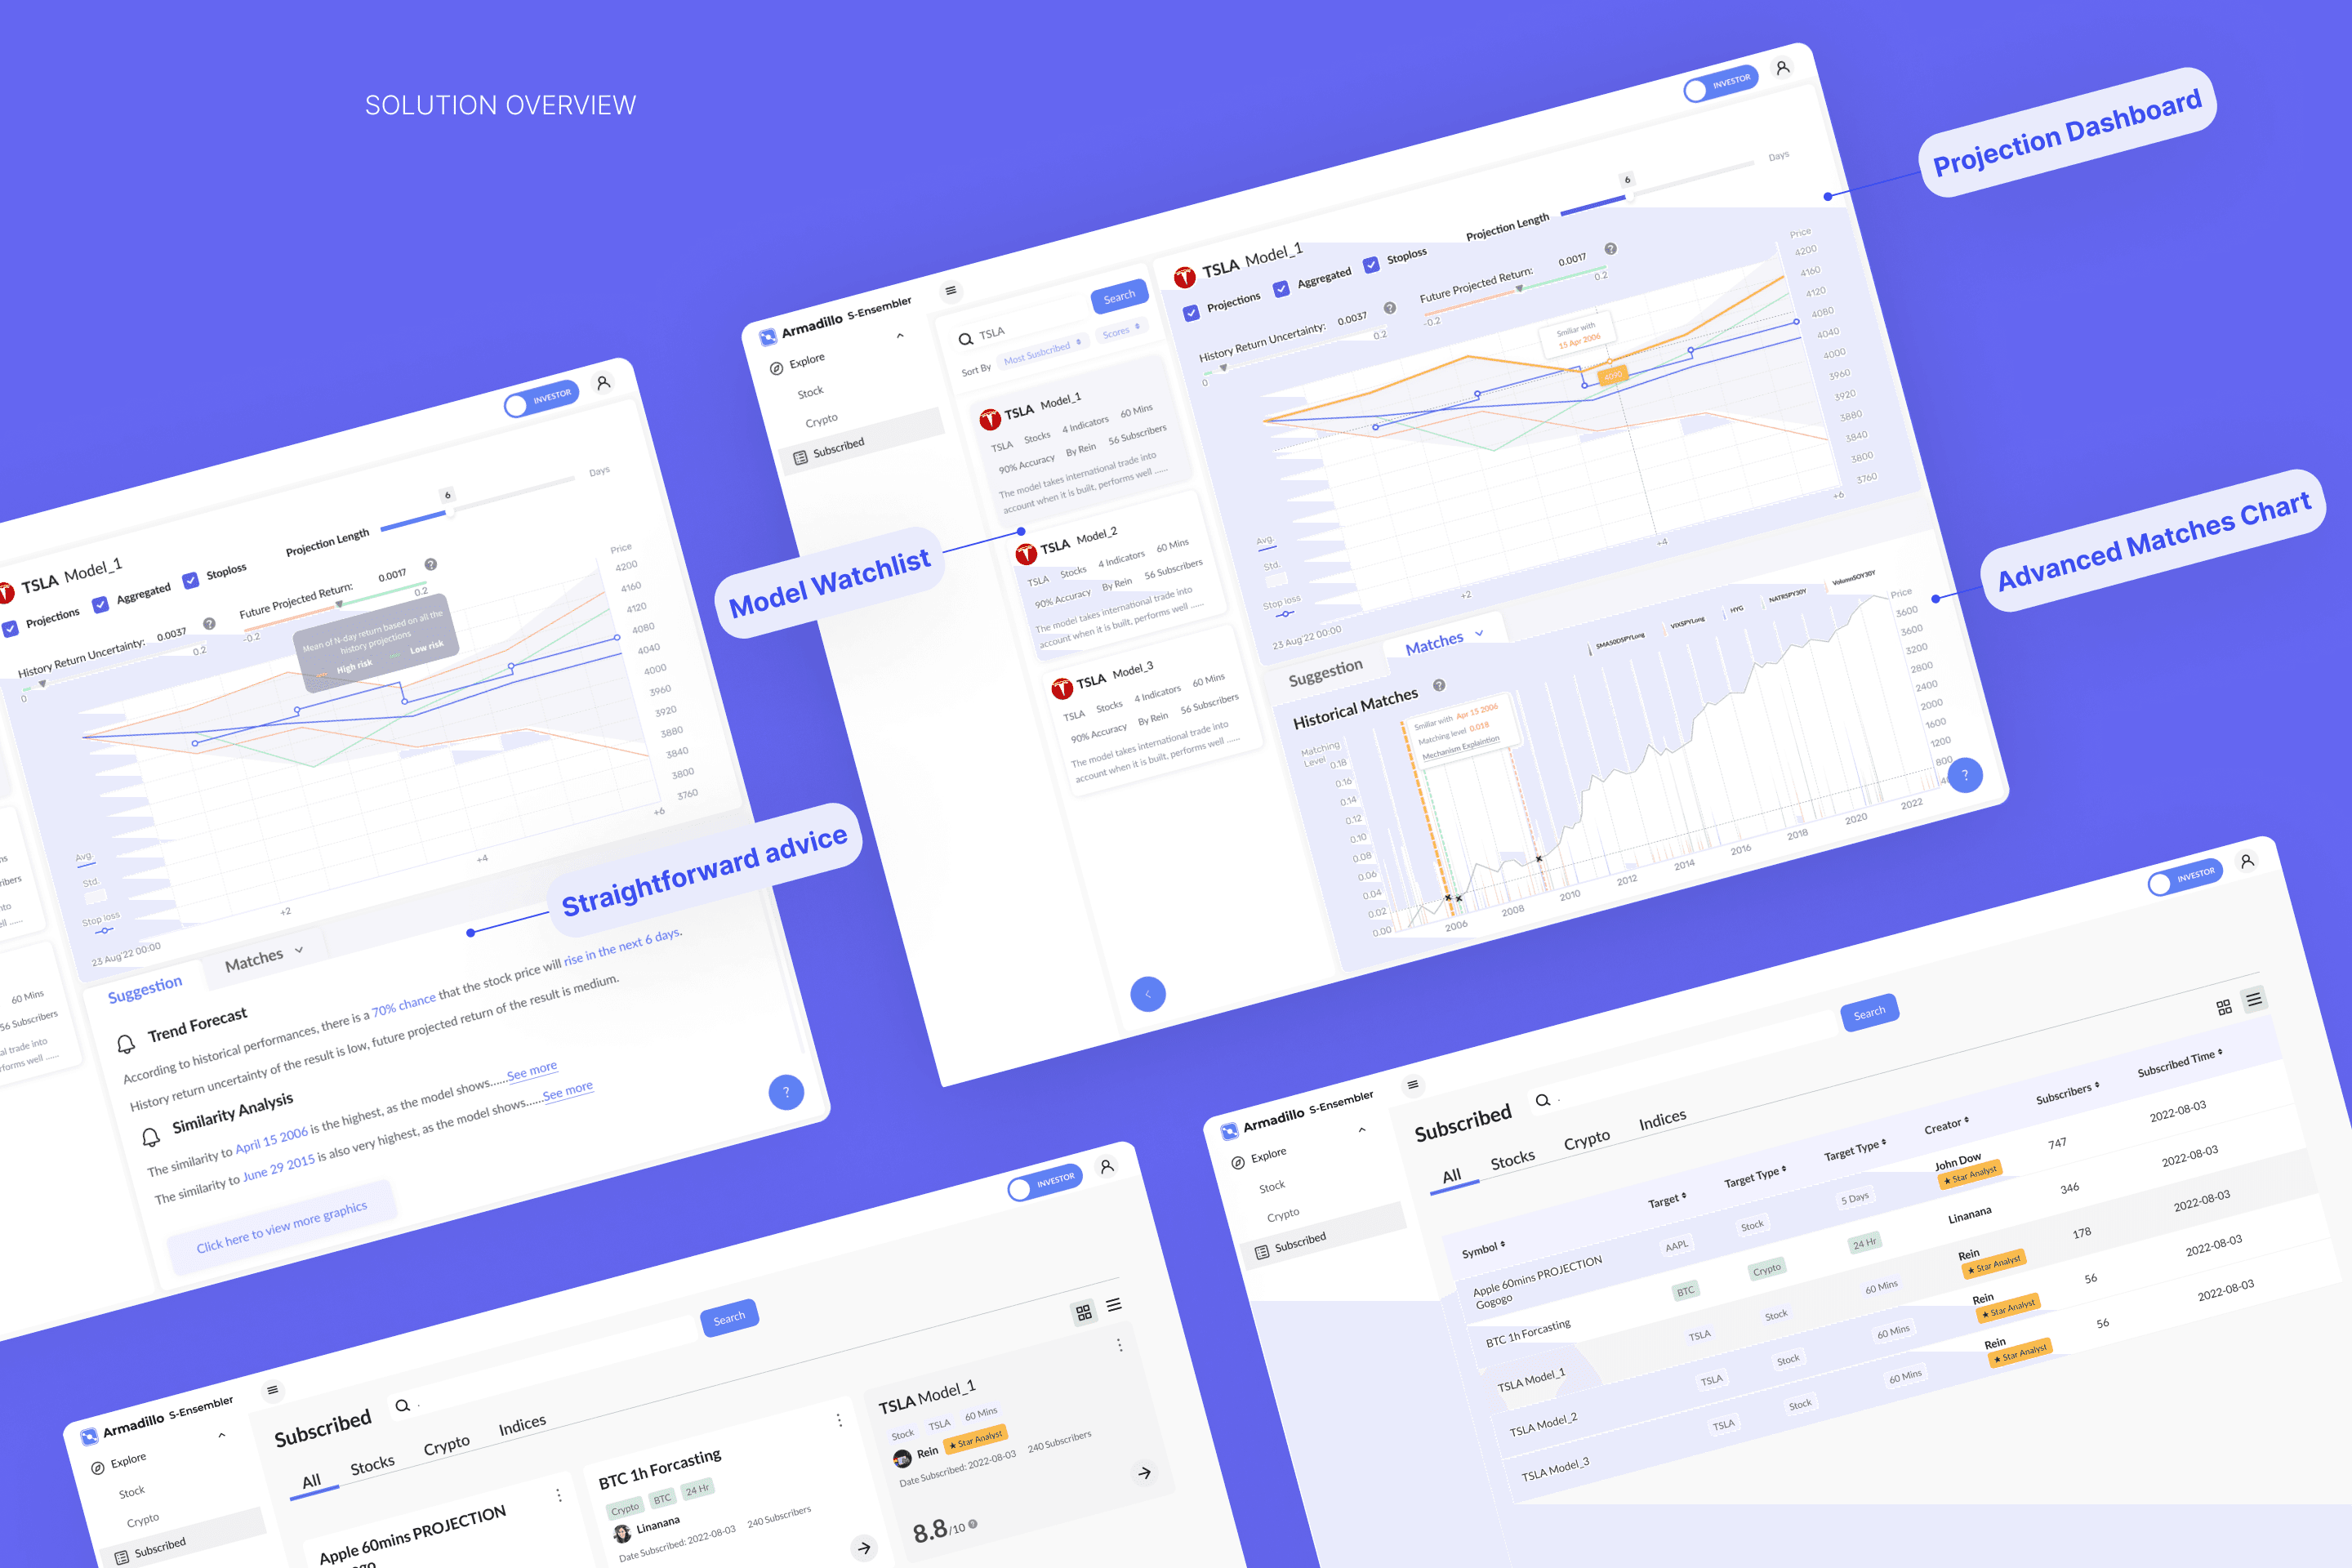
Final solutions focus on addressing comprehension and trust issues on the subscription page and enhancing the user experience with an interactive dashboard.
Final Solution
Design for Better Subscription Management
Design Change 1:
Create a page where users can easily manage their subscribed models and select the right ones using filters.
Solved Problems:
Use filters in list/card mode help users choose models and reduce using barriers. Cultivate subscription habits and help company gain profits in future.
Design for more trust on Dashboard
Design Change 2:
Add interactions and tutorials. And show similar historical data as validate prediction basis when click a prediction line.
Solved Problems:
Simplified, intuitive, and co-responding interactions keep users from getting confused. Clear accuracy and validate historical data reference make user boost trust.
Design for better understanding on projection results
Design Change 3:
Add a direct Suggestion section for entry level users. Add interaction between a trend line and the corresponding suggestion.
Solved Problems:
Clear and co-responded suggestion help entry-level users make decision effectively.
Design for better understanding on projection results
Design Change 4:
Rearrange the position of the Matches chart as an advanced user feature. Change the design of the matches chart to clearly show different predictions using unique colors. Include explanations and tips for understanding historical and indicator matches.
Solved Problems:
Avoid overwhelming entry-level users with complicated prediction methods. Provide interactive charts and detailed explanations to aid advanced user’s understanding.
Reflection

01.Leveraging Research Data and User Insights to Drive Design Consensus
Research data and user quotes are powerful tools for presenting findings to the team. They not only support decision-making but also help align team members by providing concrete evidence, ultimately driving consensus and influencing the design direction effectively.
02.Data Visualization for Accessibility and Effectiveness
Effective data visualization requires careful use of color-coding for clarity and accessibility, balancing information quantity, well-designed tooltips for added context, and ensuring accessibility through screen reader compatibility, keyboard navigation, and clear labels for inclusive design.